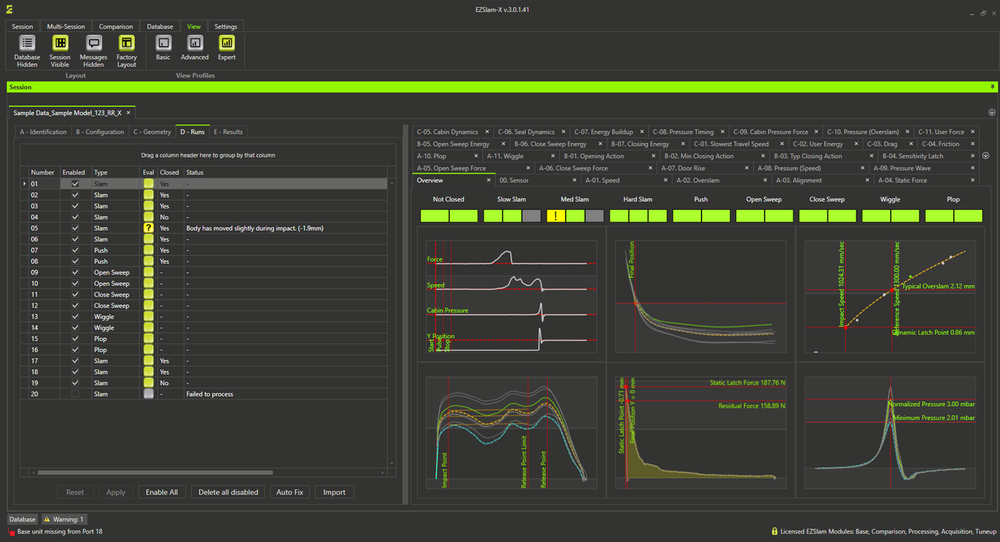
EZSlamX integrates precise algorithms and scientific methods into a simple, comprehensive tool for closure measurement. It uses combined Integrated Model for combining the information from several tests in one model to determine the iterative testing. This software comes with 22 different graphs to identify the metrics. This software manages all the data acquires with one or more EZ Slam devices.
With the new updates on EZSlam platform, EZMetrology aimed to excel on 3 levels:
1. Improved User Friendliness and accessibility of Software
2. Optimized Methods based on the experience with our worldwide customer base
3. New analytical models and expand the metrics to enhance the understanding of the door
The EZSlam software is a program used to log data from the EZSlam Devices via Bluetooth. The EZSlam innovative design measures and stores door closing data for the complete closing event. EZSlam integrates precise algorithms and scientific methods into a simple, comprehensive tool for closure measurement. It translates subjective impressions into objective numbers. It uses combined Integrated Model for combining the information from several tests in one model to determine the iterative testing. This software determines the correlation between different metrics and broadcasts the critical intersection points. This software comes with 22 different graphs to identify metrics. This software manages all the data acquired with one or more EZ Slam devices. The data can be exported into a csv file.
Developers can investigate dependencies between components and optimize tolerances bands
Simple user interface
One page result overview
Statistical view
Automatic reporting in a .csv file with all the images of the graphs
22 graphical representations for better understanding of the calculated data
Reporting based on tolerances
Language & unit selection
OS: Microsoft windows 10
Processor: Intel Core i5 or higher
Memory: 8 GB RAM or higher
Hard Drive: 256 GB SSD
USB 2.0 ports Minimum 2
USER EXPERIENCE:
A new graphics engine has enabled a more intuitive control interaction.
• High Contrast Color Scheme
• Interactive Graphs
• Cursor Function with Readout
• Expansion from Overview
• Improved Navigation Tools
• Set of 3 View Configurations: Basic, Advanced and Expert View
ACQUISITION COMFORT:
Before each Run the user has a glance at a self check of all sensors to avoid any late starts or early endings of the recording. Upon completion a color coded progress bar provides feedback to the user and confirms the correct flow. It would, if required, flag a questionable operation. A simple click in the progress bar will point the user in the direction of the solution.
NEW METRICS:
New metrics have been added to quantify certain events in higher detail.
• Separation of Cabin and Seal Air influence.
• Pressure(mbar) vs Y(mm)
• Vacuum Peak
• Static and Dynamic Latch Point
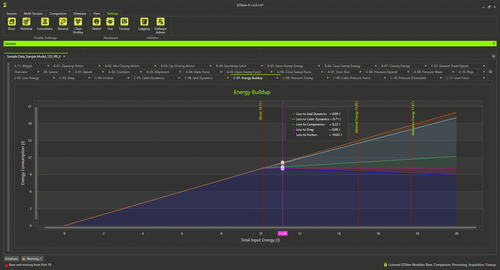
• Check Boost Energy
• Closing Energy in Watt
• Typical Energy Distribution
• Prediction of Closing Energy Variation in Function of Latch Alignment
• Predictive Cumulative Improvement


Would you like to learn more about our products or services? We are happy to provide you with more information.


